NHL MODELING & ANALYTICS
TOP TEAMS
TODAY'S GAMES
ELO TRENDS
LEAGUE NEWS
Standings
| Rank | Team | W | L | Win % | GP | ELO |
|---|
Filters
League Leaders
Trend Filters
Win Percentages
Active Streaks
Elo Rating Changes
Recent Form
Advanced Metrics
Odds Movement
LEAGUE SCHEDULE
Most betting tools focus on making picks. Oddizer focuses on finding value — and tracking whether that value actually makes money over time. I kind of think this is kind of an important consideration.
Quick version: pick a model, run it against historical odds, see if it would've been profitable. If yes, save it and get predictions for upcoming games. If not, tweak it or try something else.
New to modeling? Read this first
The core idea
You're not trying to pick every winner. You're trying to find bets where the odds are wrong.
Say a team has a 40% chance to win but the odds imply 33%. That's value. You'll lose more than you win, but the payouts more than make up for it. A 32% win rate on +200 odds is profitable. Most people don't think this way — they chase winners and ignore the math.
Strategy types
Statistical models use team stats to predict scores. Power ratings (like ELO) rank teams by strength. Situational plays target specific spots — home dogs, rest advantages, revenge games. Market models follow where sharp money is going.
This tool has 30+ models covering all of these. You can run them individually or combine them.
Odds shopping matters
Getting -105 instead of -110 sounds small. Over 500 bets, it's the difference between losing and breaking even. Always compare lines. Use Another Odds Board to find the best price — it's free edge that requires zero skill. It is free to anyone who wants to use it, not just paid subscribers.
Closing line value (CLV)
If you bet a team at +150 and they close at +130, you have closing line value. The closing line is the market's final answer after sharp bettors have had their say. Consistently beating the close is the best predictor of long-term success — even individual bets you lose.
Use the timing slider in Step 3 to test your strategy against opening vs closing lines. Running a strategy with opening odds then closing odds and comparing the delta in ROI will let you see which side you're on.
The vig is real
On -110/-110 spreads, you need to win 52.4% just to break even. Books take ~4-5% on spreads/totals, more on moneylines and way more on props/parlays. You're starting in a hole. Factor this into your expectations.
Reality check: why this is hard
Books employ quants from t10 colleges with nothing better to do with their lives than trying to fleece the general public, and they can move lines, "approve" wagers, set lines based on inside information and all types of borderline unethical behaviors. They profile winners and limit them. Meanwhile, they just take public money on mispriced favorites and action on overs gives them free information.
Professional bettors target 2-5% ROI. That's considered excellent. Variance is brutal — a 55% bettor has a 10% chance of being down after 500 bets. Edges decay as markets get sharper. What worked last year might not work now.
Sample size matters more than people realize. A 60% hit rate over 50 bets means almost nothing. You need hundreds to know if something actually works.
This tool helps you find hypotheses to test with small stakes. Backtest results are a starting point, not a guarantee.
The 4 steps
1. Wager Type
Moneyline = pick the winner. Spread = will a team win by more than a certain amount? Totals = will the combined score go over or under a number?
2. Model Types
Models predict outcomes in different ways:
- Score predictors (like Weighted Moving Avg or Linear Regression) forecast actual scores — great for spreads and totals.
- Rating systems (like ELO or Bradley-Terry) rank team strength to estimate win probability — perfect for moneylines.
- Market models (like Steam) follow where the money is moving. If sharp bettors push a line down, Steam bets that side.
- Form models (like Temperature or Hot/Cold) track recent performance — bet hot teams, fade cold ones.
Try the CDF Offense/Defense model — it's often 70%+ correct but leans toward favorites. Filter by odds range to find better value on longer prices.
3. Books & Timing
Choose which sportsbooks to compare against and when to sample the odds. Slide the timing from opening lines to closing lines. Comparing your strategy against opening vs closing odds shows closing line value — if your strategy beats closing lines, you're likely on the same side as sharp bettors.
4. Filters (The Secret Sauce)
This is where you refine your edge. Run a strategy, look at the results histogram, and find patterns:
- Odds Range: Maybe your model does best on underdogs +185 or higher — 31% win rate but 24% ROI because you're trading volume for margin.
- ELO Delta: Betting teams with 200+ ELO advantage means more favorites (lower value). Try filtering 0-100 ELO edge for longer prices.
- Rest Days: In NBA, when both teams have 1 day or less rest, unders hit 57% of the time (+8% ROI).
Worked example: finding an edge
This example is from a snapshot in time. Model results evolve daily as new games are played and data changes — your results will look different.
Run the model and check results
At this point in the season, running the EWA (Exponentially Weighted Average) model on moneylines showed a flat/downward-sloping chart — not great. Overall ROI was negative or barely breaking even.
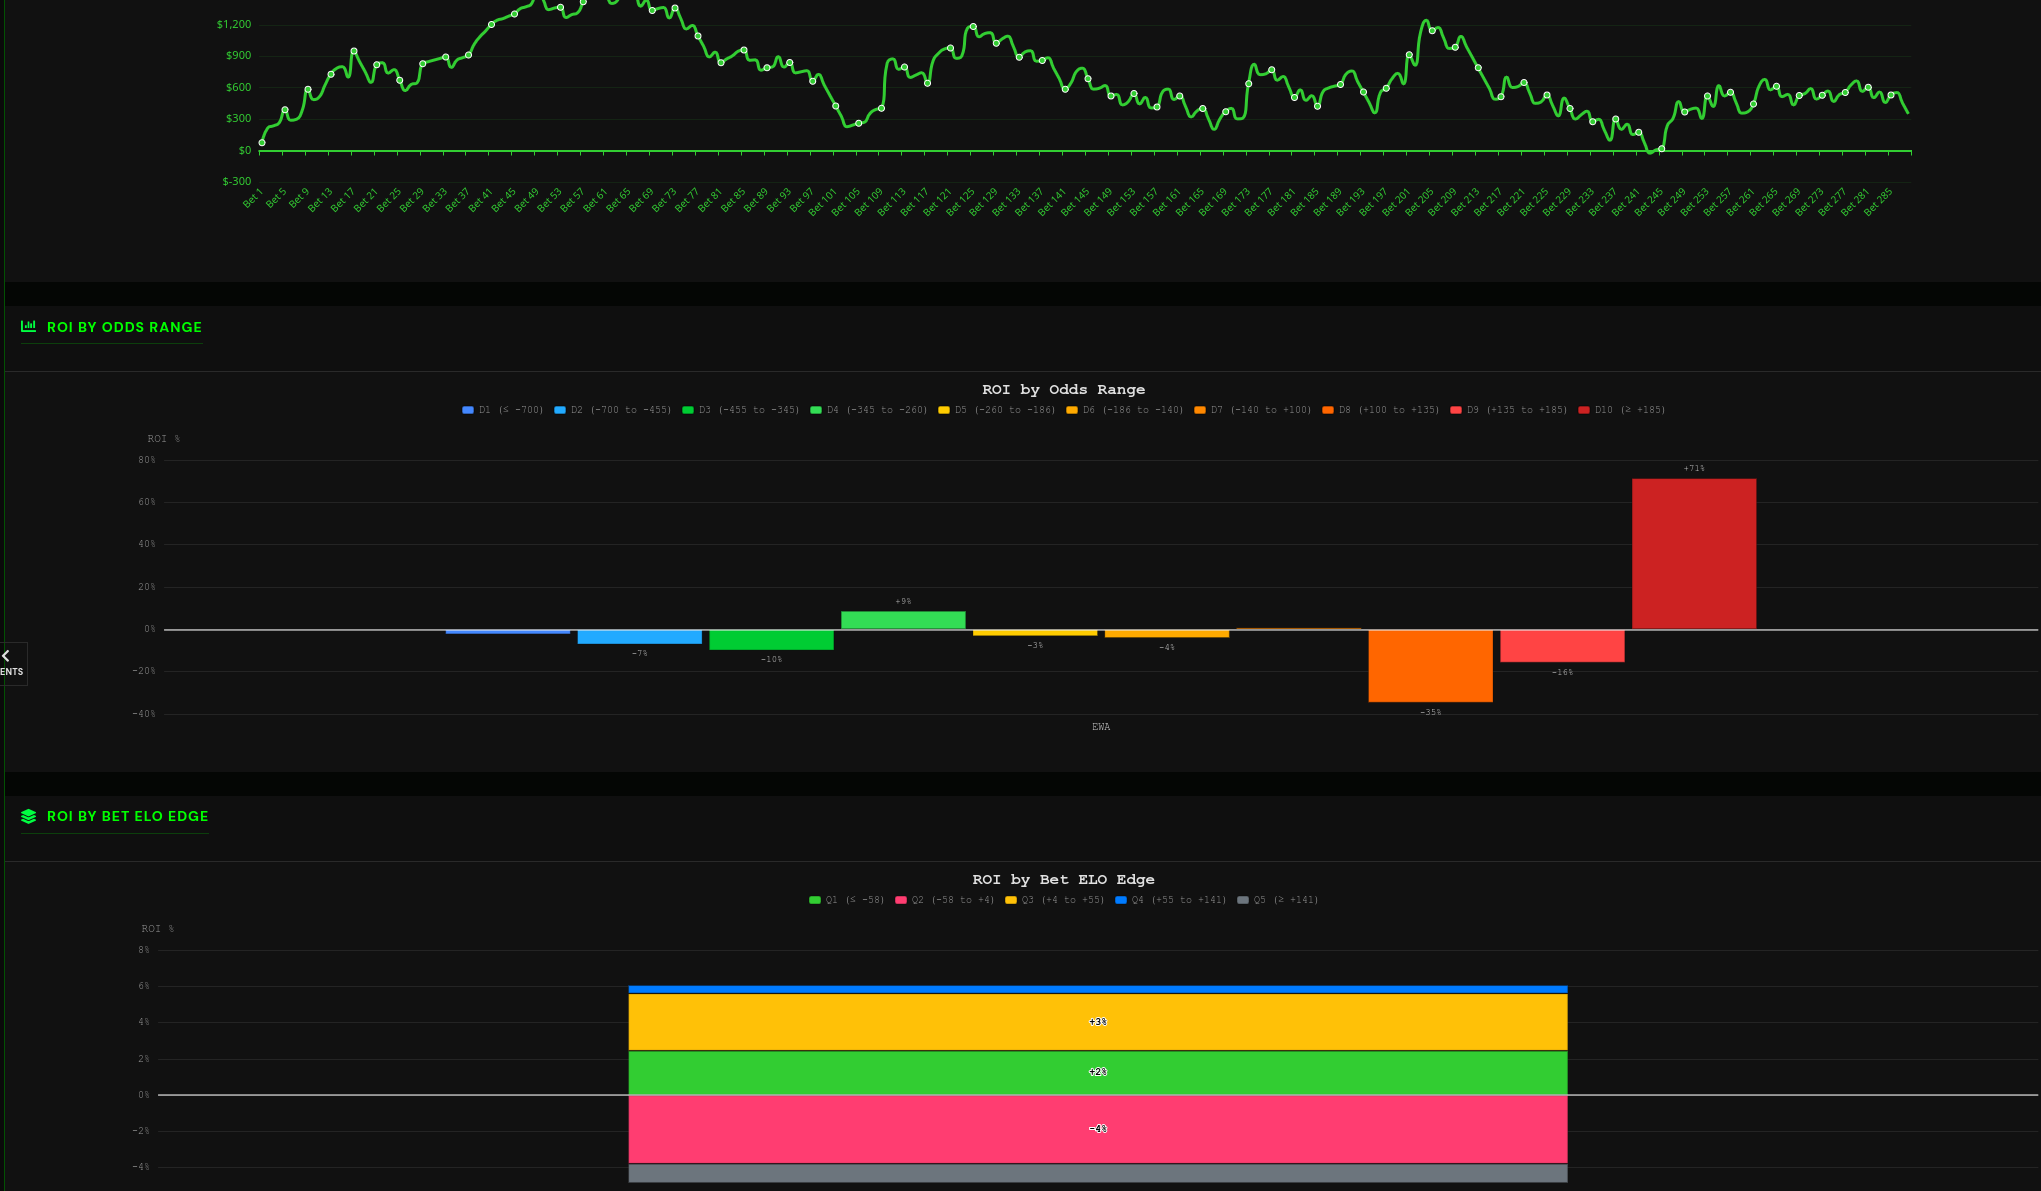
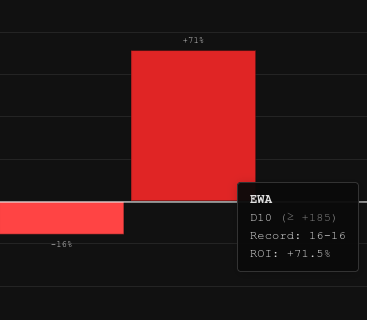
Dig into the ROI by Odds Range chart
Most odds buckets showed minimal or negative ROI. But scrolling to the right side of the histogram — the +185 and higher bucket showed 16-16 record with 71% ROI. The model wasn't profitable overall, but it was very profitable on longshots at that time.
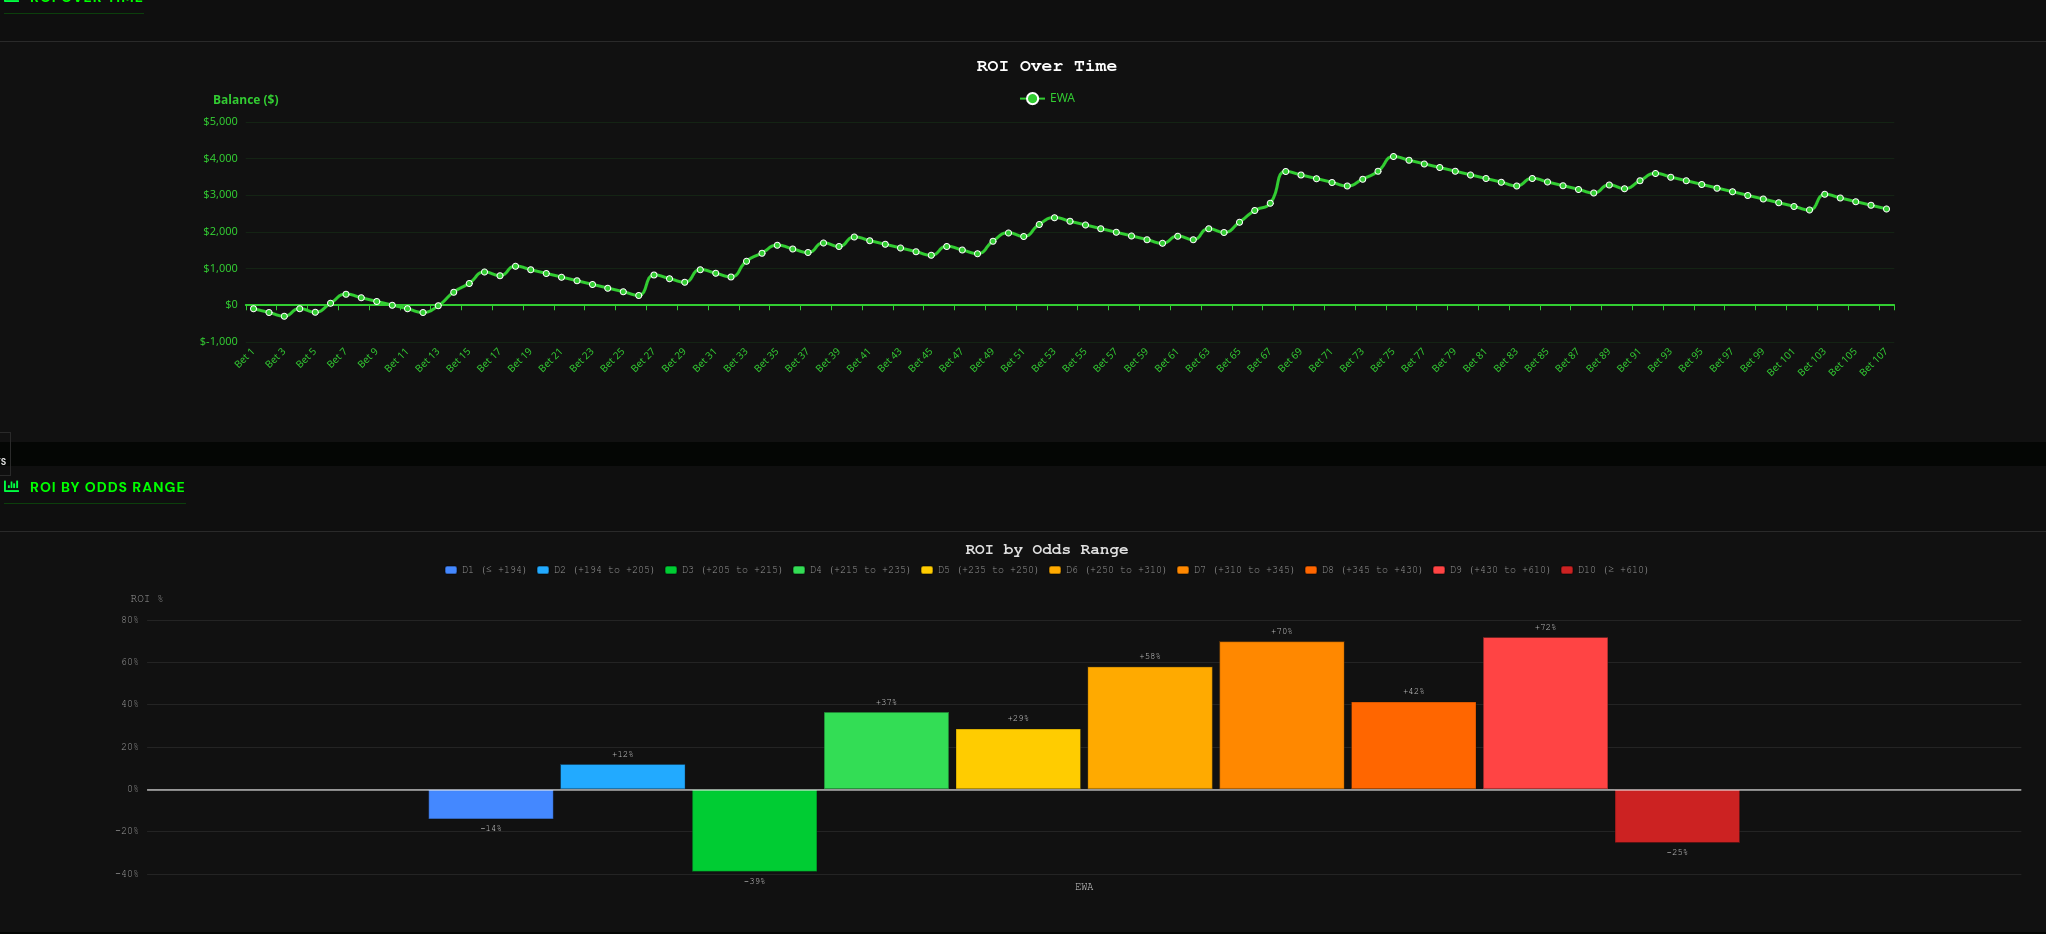
Apply an odds filter and re-run
Going to Step 4 (Filters), adding an odds range filter for +185 minimum, and re-running: now you're only betting when the model likes an underdog at +185 or longer.
At that point: 31.8% win rate, 24.5% ROI. Winning less than 1 in 3, but getting paid 2:1 or better made it profitable.
The caveat: 32 games was a small sample and could have been overfitting. But that's the process — find angles, edge cases, and situations where the math works in your favor. Some filters produce daily bets, some trigger once a week. Build a stable of strategies, track them over time, and see what holds up as more games are played.
The name of the game: statistically significant edges.
